Script Results
Scripts can be run on the fly as custom scripts. They can also be saved as scheduled scripts to be run on a regular, predetermined basis with the results sent to an application or a specified data store.
Script Results Page
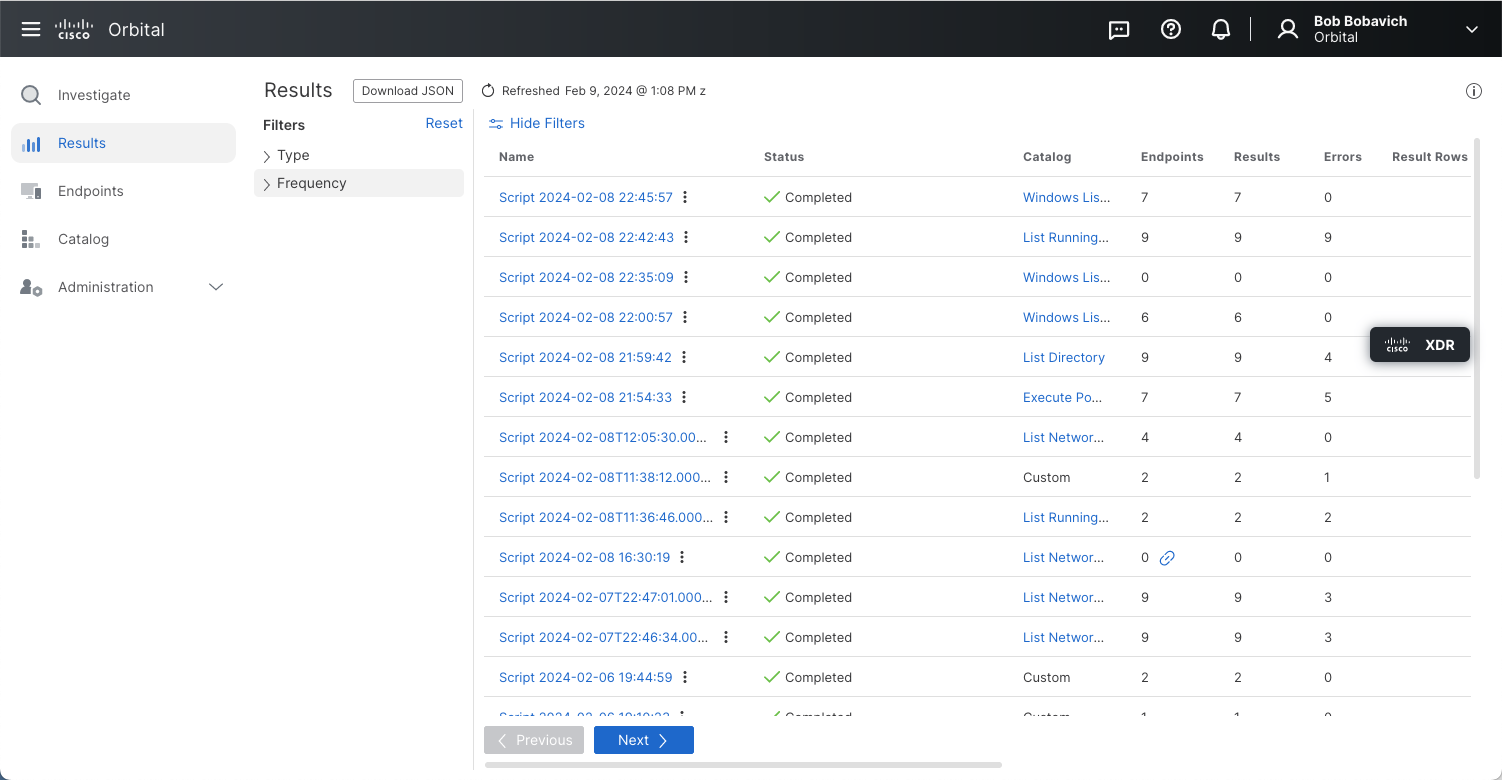
The Results page provides information about one or more script results in your organization, as shown in the figure below.
Note: Script result rows are kept for 48 hours. You should assign a remote data store if you wish to store script results longer than 48 hours.
The Results page displays a list of all the scheduled scripts for your organization, with a toggle to change the view to custom script. The page provides a high-level summary of the current status, endpoints returned, number of results, the name of the catalog script used, if any, and more. You can also access the details of each script’s results directly from this page. Additionally, you can download the results' tables in a JSON format.
This page consists of the following 15 user interface elements and columns:
| Element | Description |
|---|---|
| Download JSON | Click the Download JSON icon to download the Results page table as a JSON file. |
| Note: The maximum number of script results records that can be downloaded is 10000 records. | |
| Refreshed | The last refreshed date and time are displayed. Click the Refresh button to refresh the page view. |
| Filters | This element displays the filters that are available for use with the script results listed on this page. The available filters act on how the script will be run. The active filters are Scheduled and Non-scheduled. Selecting Scheduled will display only those scripts that have execution schedules applied to them. Selecting Non-scheduled will display only those scripts that are being run custom. Selecting both filters or clearing both filters will display all of the script results. |
| Hide/Show Filters | This element will either hide or display the Filters pane. |
| Name | Click on the Name link to open the detailed Results page, described below. Click the vertical dots to open the action menu. Options include: Rename, Copy URL, Copy ID, Reuse, Stop. If the script has expired or is an ad hoc script, the Stop option will be unavailable. |
| Status | Current status of the scripts. A percentage gauge is added for active script, showing how much has been completed. |
| Catalog | The specific catalog used by the script. Click the link to view the script information. |
| Endpoints | Shows the endpoint count in the script’s results out of the total possible endpoints. |
| Results | How many records are in the results. |
| Errors | The number of errors returned to the script. |
| Result Rows | The number of rows in the script’s results. |
| Frequency | Whether the script was Scheduled or Ad Hoc. |
| Source | Indicates whether the script is a custom script or a stock (catalog) script. |
| Created | Date and time the script was created. |
| Creator | The user who scheduled the script. |
Scheduled Script Run Time Display
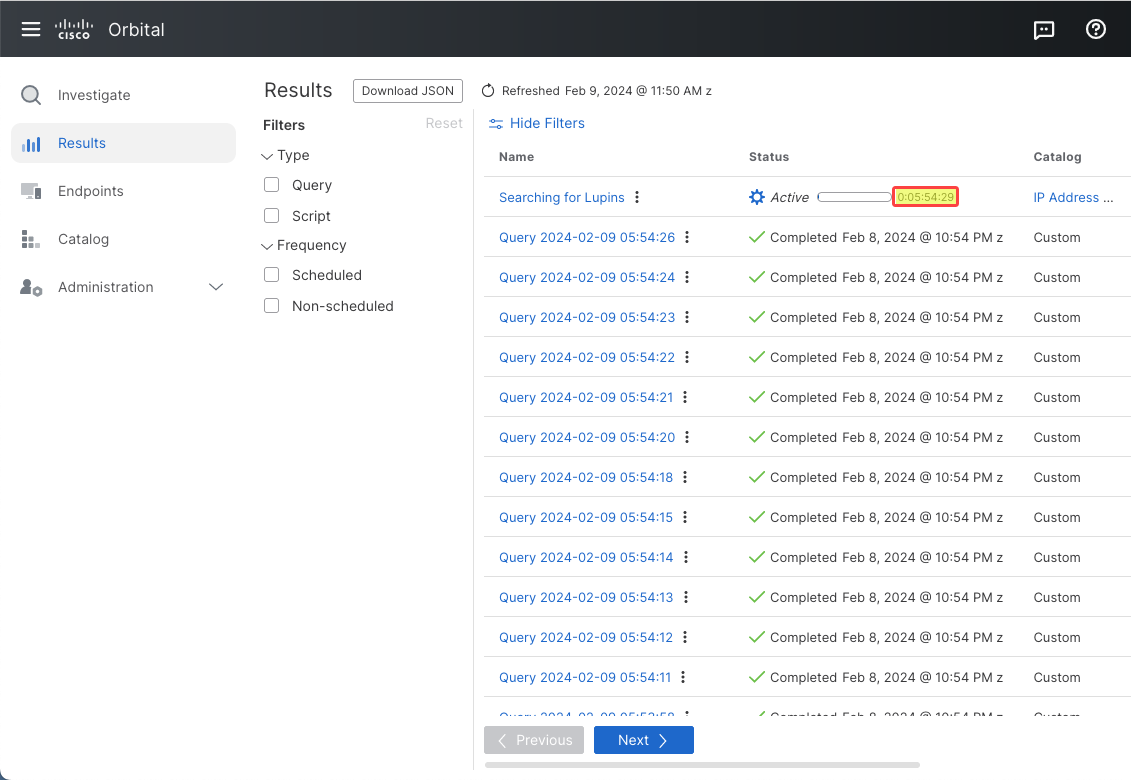
While a scheduled script is running, the Status column of the Results page will display a progress indicator, as shown in the figure below.
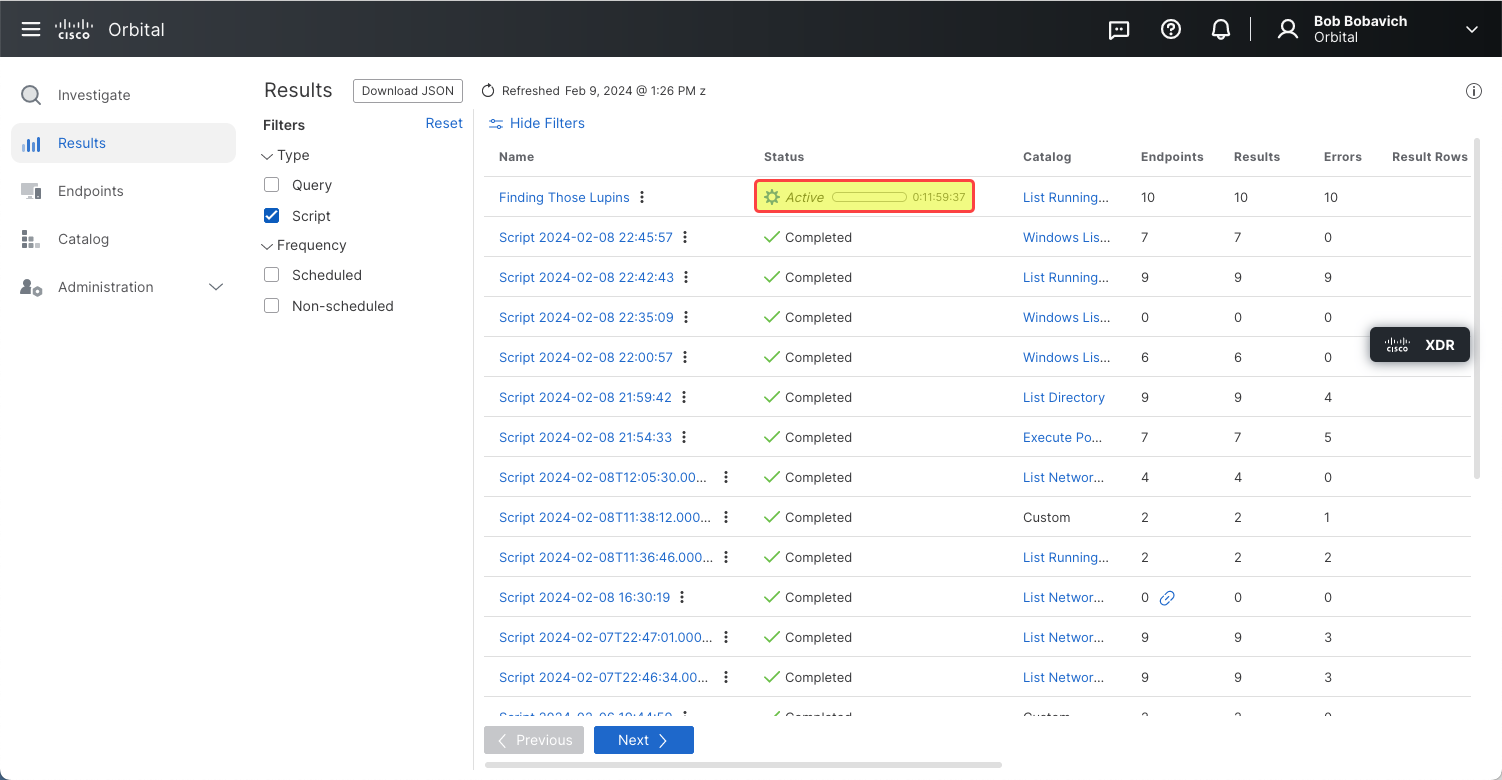
This indicator shows that the script is still running and is actively returning results. On the right side of this status display is the Time Remaining display, shown in the figure below.
This display shows the time remaining before the script finishes. The format it takes is: dd:hh:mm:ss,
where:
- dd = number of days remaining in the script’s run.
- hh = number of hours remaining in the script’s run.
- mm = number of minutes remaining in the script’s run.
- ss = number of seconds remaining in the script’s run.
Script Result Details
Orbital’s Results Details page, shown in the figure below, provides detailed information on a single script’s results. This page can be accessed by clicking the script’s Name link from the Results page.
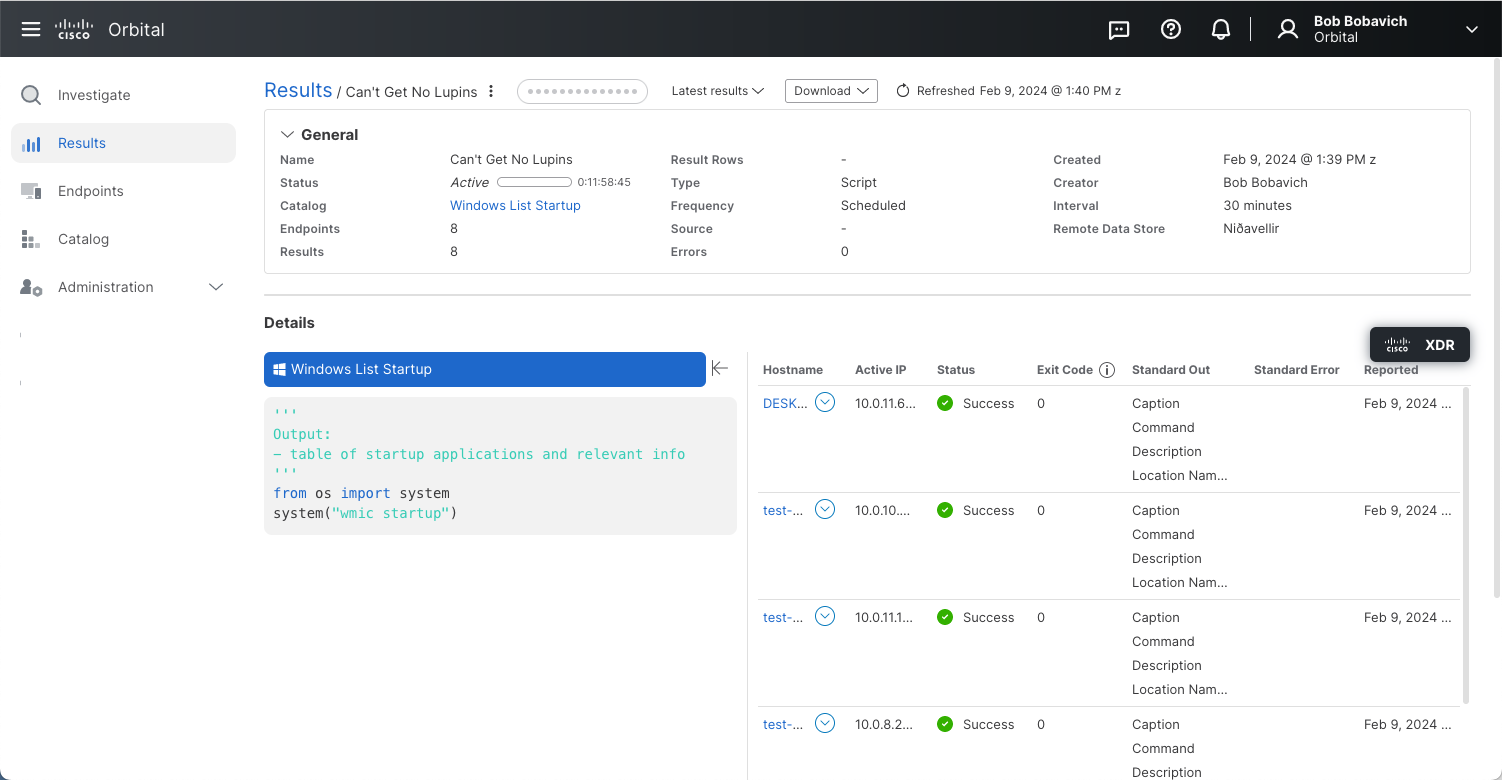
This page consists of three main information panes:
- The Result Details Controls pane.
- The General Script Information pane.
- The Results Details Node List pane.
The Script Result Details Controls Pane
The Result Details Controls pane, shown below, is used to control the information displayed on the Results Details page.

It displays the following seven user interface elements:
| Element | Description |
|---|---|
| Results link | This link will return you to the Results page. |
| Script Name | This displays the name of the script that was run. The action menu located at the right end of the script’s name contains the following three commands: |
| * Copy URL | |
| * Copy ID | |
| * Reuse | |
| MITRE ATT&CK Indicator | This display identifies which MITRE ATT&CK tactics and techniques the script adheres to. Refer to The MITRE ATT&CK Adherence section in the Investigate topic for more information on MITRE ATT&CK. |
| Note: The MITRE ATT&CK Indicator will only be displayed if the script was a stock script. Refer to the Script Catalog topic for more information on Stock Script. | |
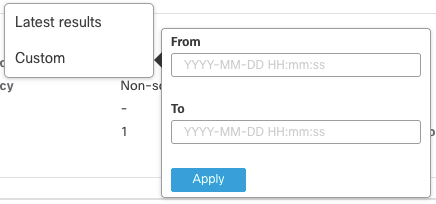
| Latest results | This dropdown, shown below, is used to filter the displayed results: |
 |
|
| The Latest results dropdown command displays the last result received from each endpoint. | |
The Custom dropdown command is used to define the date range of the results that will be displayed on the Results Details page. The From and To time input fields take on the format YYYY-MM-DD HH:mm:ss, where: |
|
| YYYY represents the year. | |
| MM represents the month. | |
| DD represents the day. | |
| HH represents the hour. | |
| MM represents the minute. | |
| SS represents the second. | |
| Show empty rows | This toggle will allow you to include or exclude rows that have not returned scripts information, for whatever reason, to the script results. The default setting for this toggleswitch is off. |
| Refreshed | Click Refreshed to display any new results that were collected from endpoints that were non-responsive during the script’s previous run. Any changes are displayed immediately, assuming the data is still available. |
| Download CSV | Clicking the Download CSV icon will download the host information in the CSV format. |
The General Script Information Pane
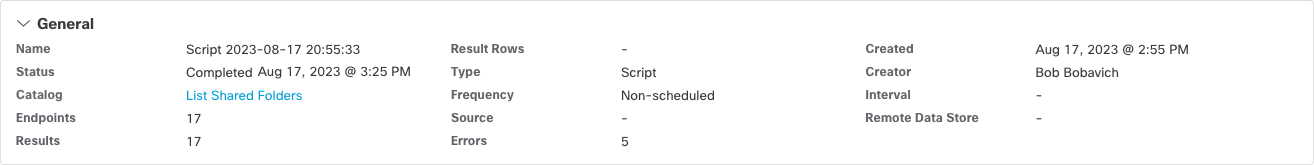
The General Script Information pane, shown in the figure below, displays specific information regarding the script whose results are being displayed.
This pane displays the following 14 user interface elements:
| Element | Description |
|---|---|
| Show/Hide Arrow | This arrow will either show or hide the General Script Information pane. If this pane is displayed, clicking the Show/Hide arrow once will hide the pane. If the pane is hidden, clicking the Show/Hide arrow once will display the pane. |
| Name | This field displays the name assigned to the script. |
| Status | This field displays the current status of the script. If the script is in progress, a progress indicator will be displayed, as shown in the figure below. |
 |
|
| If the script has finished execution, the date and time that the script finished executing is displayed. | |
| Catalog | This field displays the name of the script, as it is listed in the Script Catalog. If the script has been created by the user, the value for this field will be Custom. |
| Endpoints | This field displays the number of endpoints that have returned script results. |
| Results | This field displays the total number of times that Orbital has received a response from all of the endpoints targeted by the script over the duration of the script. |
| Result Rows | This field displays the total number of rows of results that have been returned for the script. |
| Frequency | This field displays whether the script is a scheduled or non-scheduled script. |
| Source | This field displays the name of the Cisco service where the script originated, such as Threat Response or Secure Endpoint. |
| Note: If the script originates from Orbital itself, this field will be left blank. | |
| Errors | This field displays the number of script results that are returned containing errors. |
| Created | This field displays the date and time that the script was started. This can be the date and time that the user created and ran a custom script or the date and time that the user started running a stock script. |
| Creator | This field displays the name of the name of the user that created and/or ran the script. |
| Interval | This field will only display a value if the script is a scheduled script. If the script is a scheduled script, this field displays the schedule’s frequency value. This value is discussed in greater detail in the Schedule Orbital Script Popup section of the Schedule Orbital Scripts topic. |
| Remote Data Store | This field displays the name of the remote data store that the script has sent the results to. This field will only display a value if the remote data store has been set. |
The Script Results Details Node List Pane
The Results Details Node List pane, shown in the figure below, displays a list of the endpoints and any detailed results that have been returned. This pane is similar to the Results pane on the Investigate page. Each page will show up to 25 results. If more results are returned, pagination buttons are available at the bottom of the page.
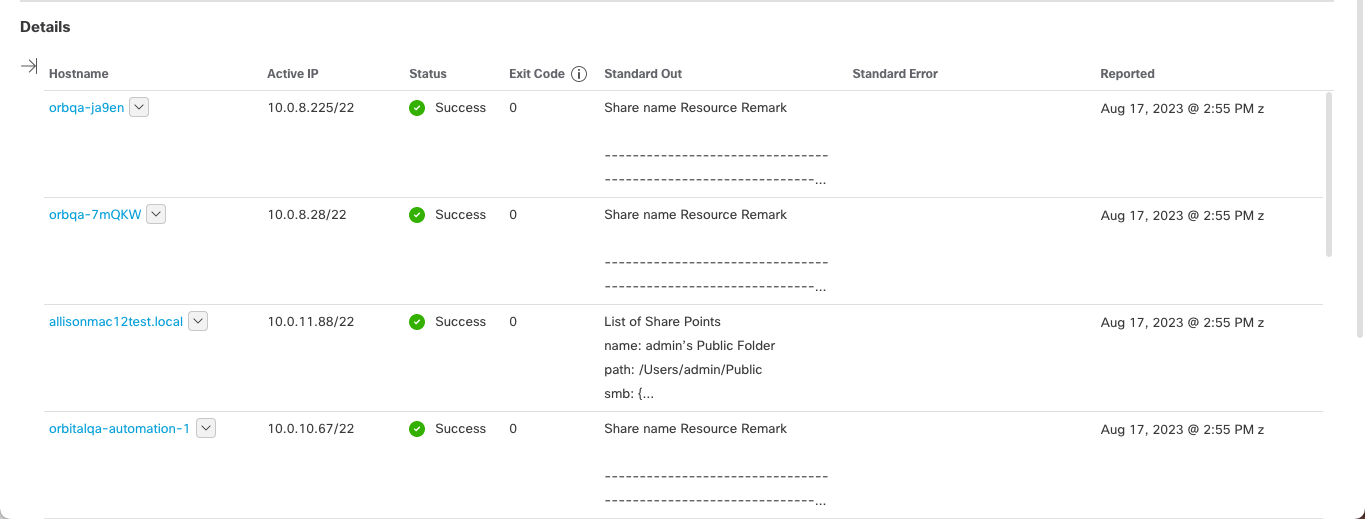
The result details for each endpoint listed is listed in the Results Node Details pane.
More Info
- Orbital Results - A description of Orbital results.
- Orbital Script - A description of Orbital’s Script.